Developments in recent centuries have brought us great progress. Simultaneously, our planet has grown ill and its societal problems have been continuing. Some symptoms are getting worse. The many ecological, societal and economic events, challenges and risks might seem unrelated, far away or even irrelevant. Solving one problem often leads to causing another one later or somewhere else. It is a fact that the global challenges and risks affect everyone, everywhere. Very often it’s difficult for us as individuals to see the wood for the trees. Nevertheless, before we start considering an effective approach and solution, it is crucial to truly understand the challenge(s) ahead.
The Global Risks Report 2018
We are facing serious global problems, complex challenges and diverse risks. It is not sufficient to confine our view to environmental aspects. At The Natural Step, we consequently include societal, economic, geopolitical and technological challenges and risks as well. It is crucial to understand the interconnections between the biggest global problems, risks and trends. The World Economic Forum (WEF) defines a global risk “as an uncertain event or condition that, if it occurs, can cause significant negative impact for several countries or industries within the next 10 years.”
2018 is a challenging year. This year’s Global Risks Report highlights the growing strain we are placing on many of the global systems we rely on. It underlines the fact that we are facing systemic challenges that have intensified over the past year. This year’s report covers more risks than ever, but focuses in particular on four key areas: environmental degradation, cybersecurity breaches, economic strains and geopolitical tensions. Please see below how the global risks are interconnected. More information can be found here.
The Global Risks Landscape 2018
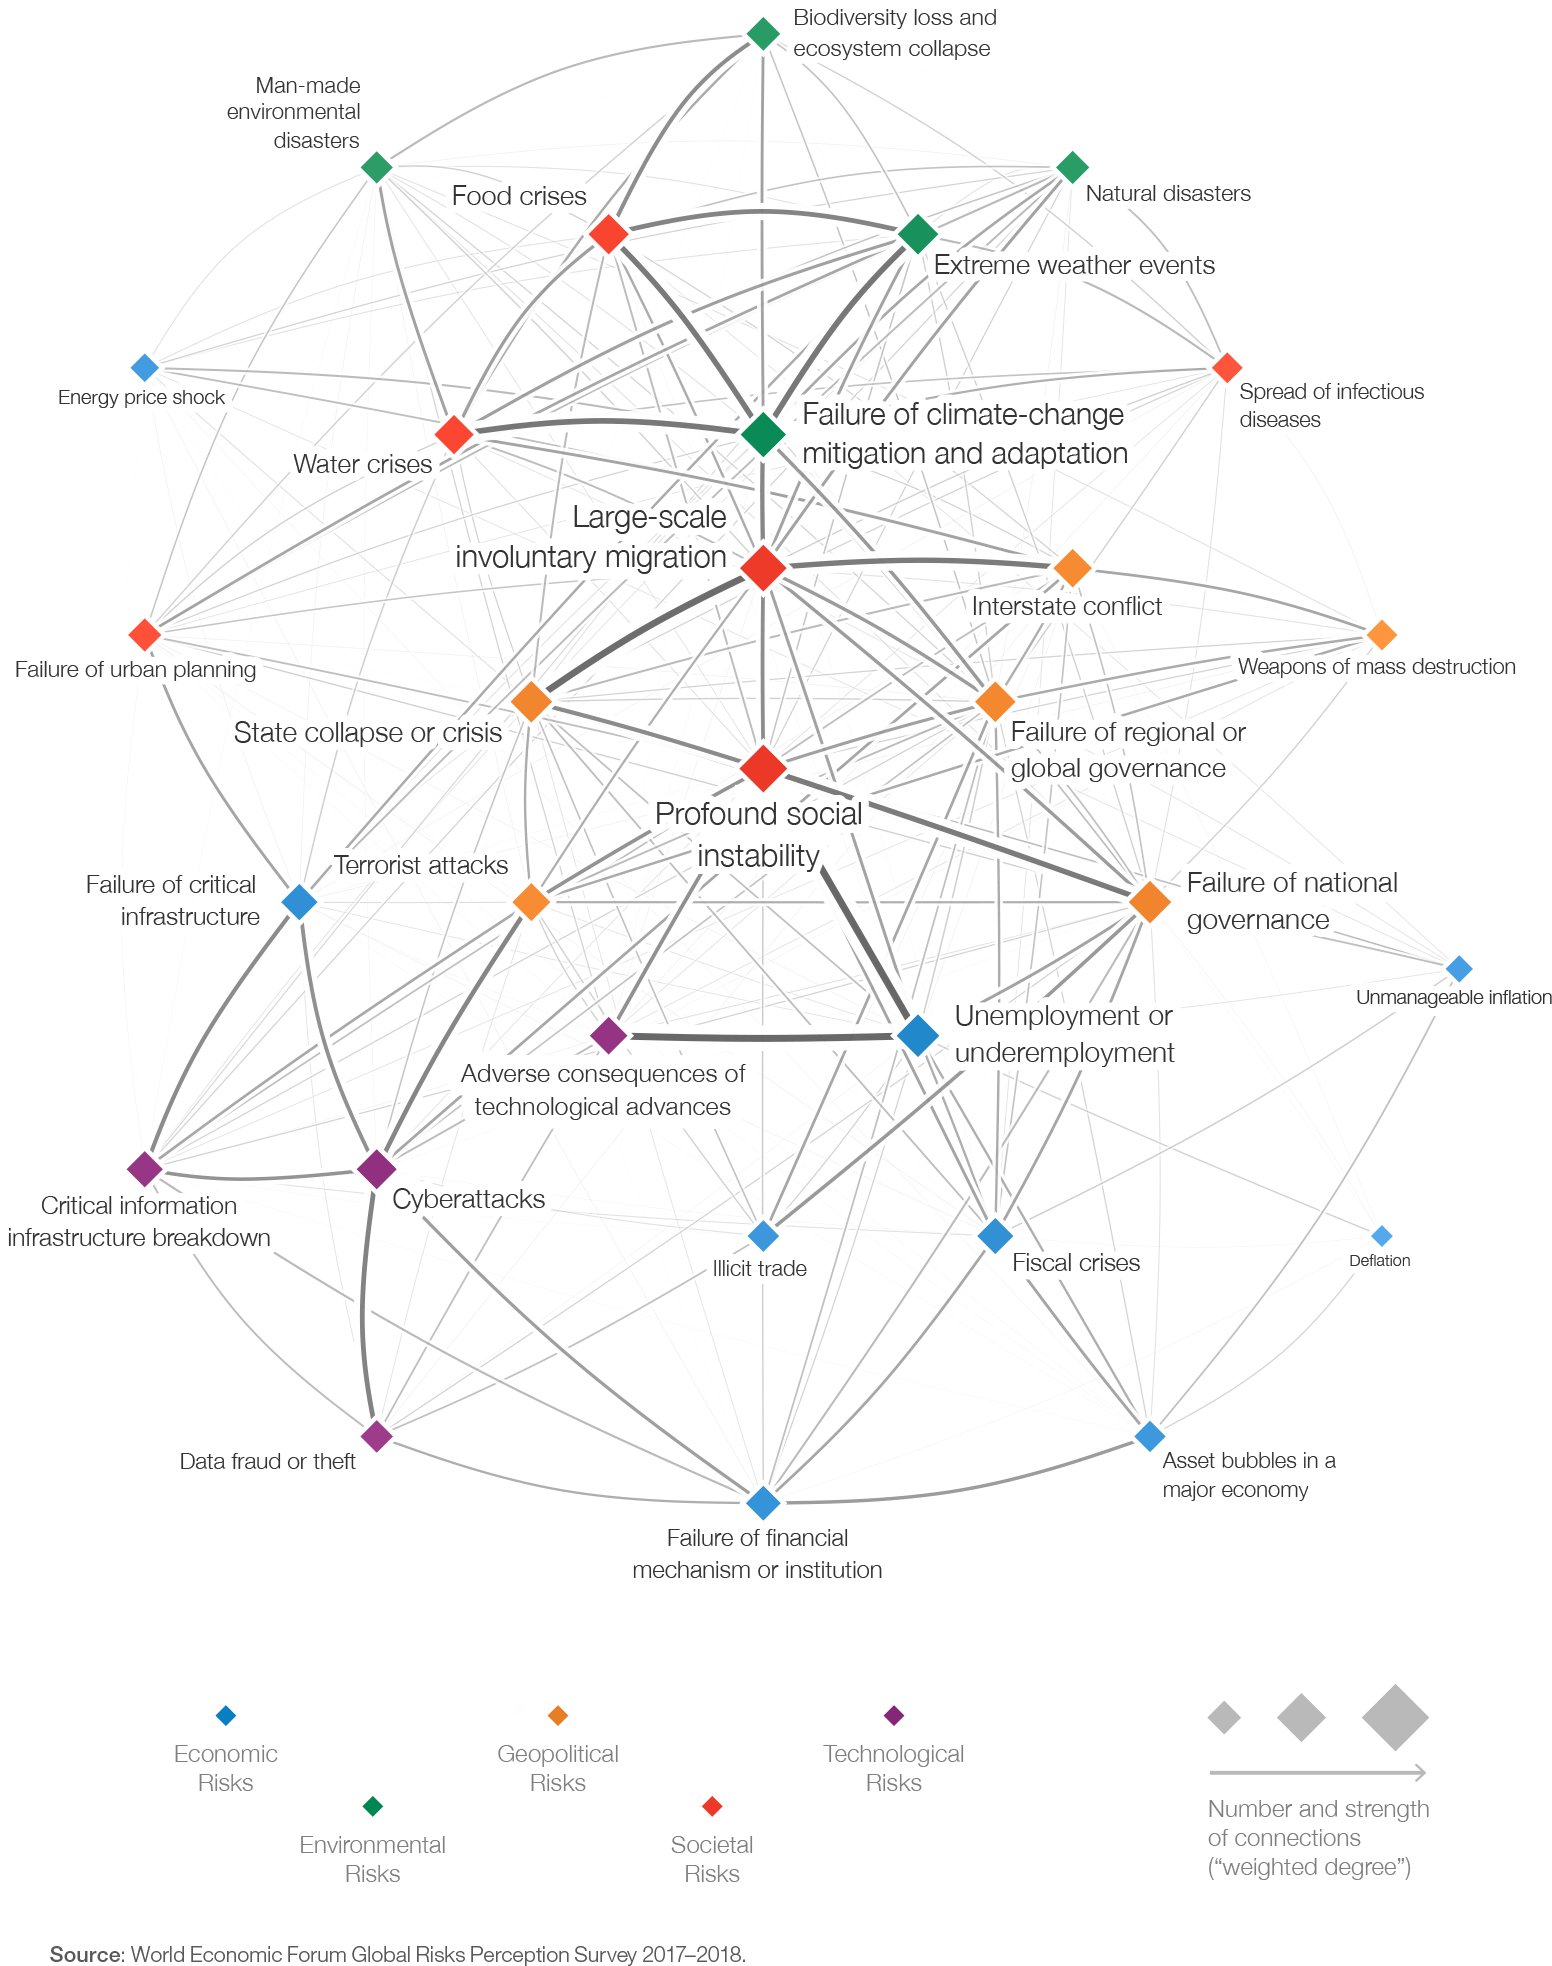
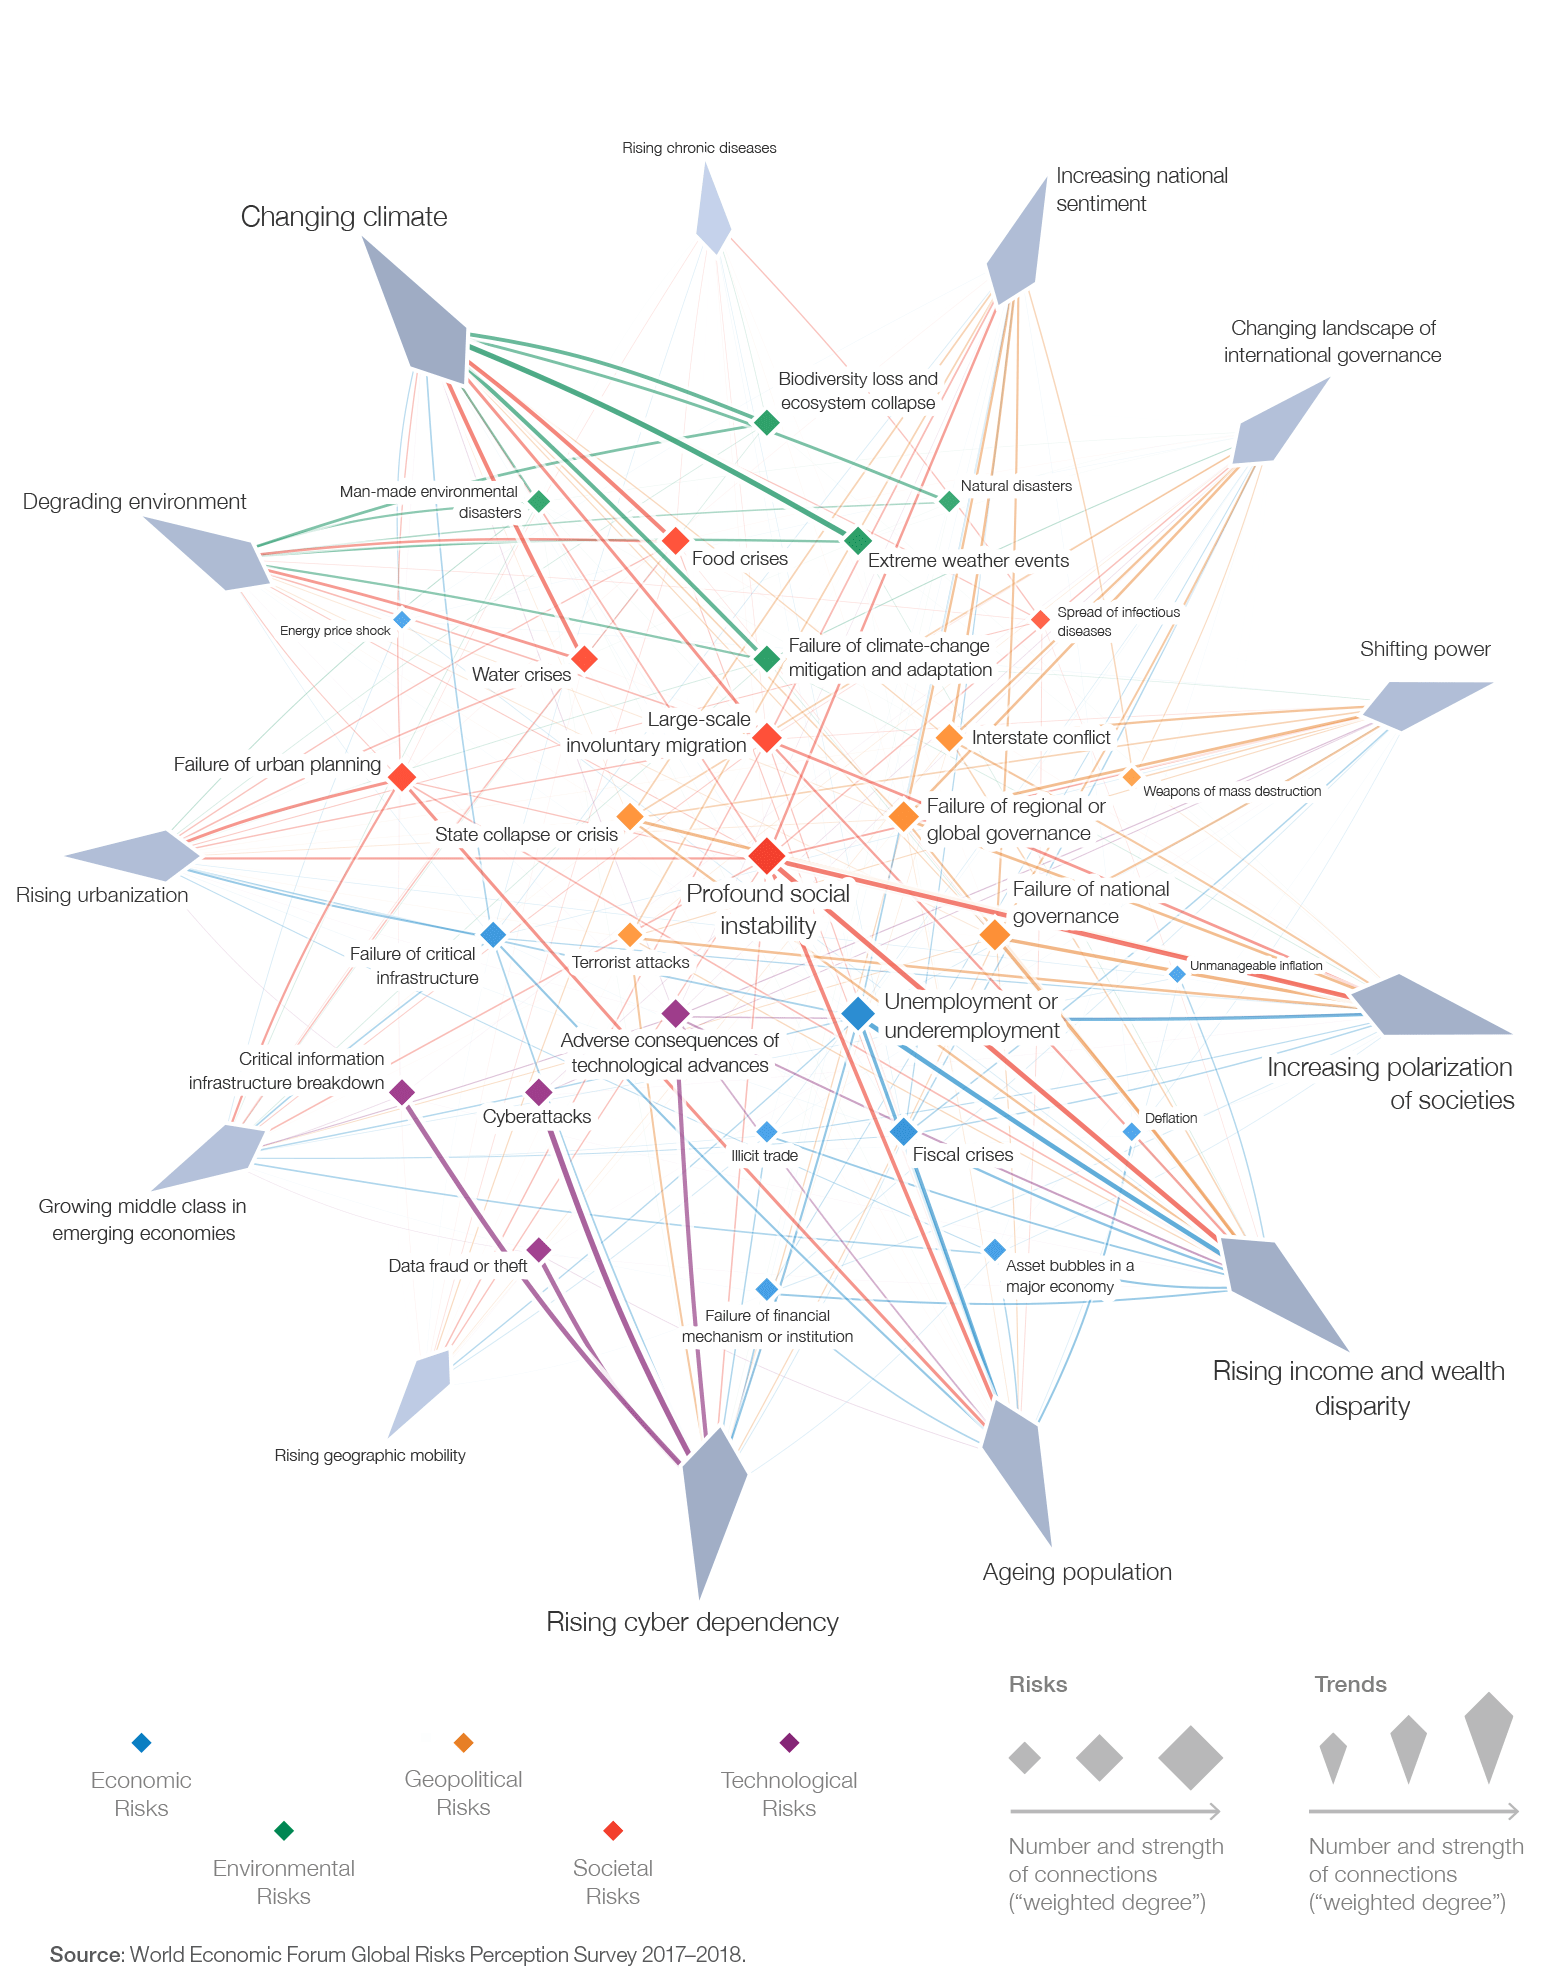
Risks-Trends Interconnections Map 2018
Please have a look at our executive summary of the 13th edition of The Global Risks Report 2018 and find about more about the Global Risks 2018 by clicking the link below.
Using metaphors to illustrate paradigms
We have to recognise that different people see the world in different ways, using different lenses for interpreting acquired information and knowledge. At The Natural Step, we call these different views “paradigms”. As soon as we have understood a paradigm and how this worldview is built up, we can identify and address any flaws in its logic. Let’s start by having a closer look at a dominant worldview in society today.
THE CYLINDER PARADIGM
Although it is assumed that societal or ecological problems are serious, each problem is seen as a relatively isolated, unconnected event that will come and go. These problems are perceived as necessary by-products of progress with minor, non-lasting impacts on life-supporting systems, for example:
- hunger in Africa caused by a drought
- flooding due to extreme weather
- an involuntary mass migration driven by a civil war
- obesity due to unhealthy eating habits
- disclosure of a corporate or political scandal where truth is bent in self-interest
- extinction of a seemingly unimportant species
- an epidemic
Using the metaphor of a cylinder, we move through this cylinder over time with horizontal walls representing only some limitations. In general, these are determined by the availability of resources, people’s tolerance and the insignificant impact on the steady state of both our environment and society. Series of events with negative impacts, such as geopolitical tensions, lack of transparency, inequality, gaps in the ozone layer, climate change, unhealthy diets, air pollution and so on, are perceived as phenomena that we can overcome by economic growth, technological developments and quick fixes.
THE CYLINDER PARADIGM

Aspects of development
When dealing with our everyday economy, issues of society and the environment are often considered as completely separate. Or they are not considered at all.

For most of human history, human society has been small in comparison to the biosphere, with limited needs and causing minor effects. However, since the beginning of the industrial revolution, society has grown both in size and power. Cultural and technological advances, especially over the past centuries, have brought us progress in the form of access to knowledge, eradication of diseases, global increase in life expectancy and developments that enable comfort. The economy has been the driving force behind development, without consideration being given to its impact on society and environment.
These developments are having a larger and growing impact on the biosphere and its ecosystems – some examples:
- human-driven greenhouse gas emissions from burning fossil fuels
- human-caused flows of metals and minerals surpassing the volume of natural flows
- a large percentage of land used for agriculture, infrastructure and cities
- synthetic chemicals produced by industries


Meanwhile, human society faces continuing and sometimes worsening problems, such as abuses of workers’ and human rights, diseases, malnutrition, inequality and the lack of access to education.


IN A NUTSHELL
Within the paradigm of the cylinder, it is recognised that there are limits to what the societal and ecological systems can provide. However, it is not recognised that the ability to provide those resources and services is being systematically degraded. The interrelations between the economy, society and the environment are not properly understood, nor are their impact. People therefore tend to underestimate the seriousness of the sustainability challenge.
HDI and ecological footprint
How can relevant developments, based on sound scientific data, be summarised so that they can be easily understood? For example by combining data on human and environmental aspects and by looking for trends.
The United Nations Human Development Index (HDI) summarises the well-being of people in such respects as a long and healthy life, knowledge and a decent standard of living. At a scale from zero to one, the United Nations defines 0.8 as being worth striving for. It simplifies human development and does not reflect inequalities, poverty, human security, empowerment, etc.
The Ecological Footprint shows us the degree of impact on nature’s biocapacity in society’s efforts to keep up with consumption. We have only one planet to live on. In 2012, we had a maximum average of 1.8 hectares per person available. This figure is shrinking due to global population growth. Actual usage, however, equals an average impact of 1.6 planets!
You will notice the two large red dots representing India and China, and the larger blue dot in the upper right representing the United States.
Human Development Index (HDI) related to Ecological Footprint
Source: Ecological Footprint data from Global Footprint Network 2016, National Footprint Accounts, 2016 Edition, HDI values from UNDP
")
")
")
Source: Ecological Footprint data from Global Footprint Network 2016, National Footprint Accounts, 2016 Edition, HDI values from UNDP
HUMAN DEVELOPMENT INDEX
Economic and social development, or human well-being, can be approximated with the widely recognised Human Development Index (HDI) developed by the United Nations Development Programme (UNDP). It was created to emphasise that people and their capabilities should be the ultimate criteria for assessing the development of a country.
The index is a summarised measure of average achievement in key dimensions of human development, such as health, education and standard of living. The HDI can also be used to question national policy choices, asking how two countries with the same level of income per capita can end up with different human development outcomes.
ECOLOGICAL FOOTPRINT
The Ecological Footprint (EF) measures how much nature we have, how much it can produce and absorb, how much we use, and who uses what. It is a reliable data-driven metric and resource-accounting tool. The Global Footprint Network calculates the global Ecological Footprint from UN and other data, showing us that the current rate of resource usage is equal to the regenerative capacity of 1.6 planets.
Among other calculations, the Ecological Footprint is applied to determine the date of Earth Overshoot Day for each year, defined as the date when human demand exceeds the regenerative capacity of our planet. Earth Overshoot Day has moved from October in 2006 to the 8th of August in 2016.
The general trend that can be seen is that when human development of a country increases, the ecological footprint increases as well, often dramatically. In other words, solving one problem creates others. Obviously, human development should accelerate while at the same time minimising the ecological footprint so that all countries eventually show in the lower right corner. The Natural Step provides a solution for both the definition of success and a proven approach to achieve it.
Planetary dashboard
Leading scientists like Professor Will Steffen, former director of the International Geosphere-Biosphere Programme (IGBP) have developed the “Planetary Dashboard” that was updated in 2015. The graphs show accelerated growth within society and accelerated impact because of society. As different as the indicators may be, they have two key aspects in common:
- Almost all indicators show that the most dramatic shifts have occurred since about 1950, hence seen as the starting point of the “Great Acceleration”.
- Nowadays, major earth system trends are directly linked to changes largely related to the global economic system.
From The Natural Step’s point of view, the “Great Acceleration” indicators not only show the enormous speed of change. They also clearly underline humanity’s new responsibility for our planet.
Planetary dashboard
Socio-economic trends driving …

… Earth system trends.

Socio-economic trends driving …
… Earth system trends.
Planetary boundaries
As individuals we can observe different symptoms in the environment around us that reveal the negative effects of global societal behaviour, such as extreme weather events, dwindling biodiversity, smog-polluted air, plastic waste in the environment and the bleaching of coral reefs. Through the lenses of science, the concept of Planetary Boundaries shows nine essential aspects of our planet and their boundaries, and their transgression is driving uncertainty and increasing the risks for humanity. First introduced in 2009 and updated in 2015, the Planetary Boundaries concept was developed by a group of environmental scientists led by Dr. Johan Rockström from the Stockholm Resilience Centre (SRC) and Will Steffen from the Australian National University.
Planetary Boundaries

The funnel as the base for diagnosis
THE FUNNEL PARADIGM
The previously shown cylinder paradigm does not recognise that trends are moving from a steady state with normal fluctuations into a state with abnormal fluctuations, crossing the tipping points of safe operating space. The situation is deteriorating. To illustrate this we use the metaphor of a funnel instead of a cylinder.

NARROWING OF THE FUNNEL
This funnel paradigm recognises that problems caused by errors in societal design have complex interrelations and are systematically weakening society’s support systems. As a global human society, we are not just destroying natural habitats, disrupting essential flows with our waste, and poisoning soils and food. We are doing this more and more, with unknown knock-on effects.
Our current societal developments and structures are not likely to slow down. Some of these effects are irreversible, such as the extinction of current species and various forms of pollution and toxicity. This can be illustrated as collisions with the walls of the funnel.
Systematic degradation makes it impossible to satisfy our basic needs over time, and it makes us vulnerable to unforeseen shocks. It becomes more and more difficult to reverse the trend since future solutions depend on the same resources. In other words, the deeper we enter the funnel, and the more the walls narrow, the more constrained, limited and unpleasant are our available options to solve the problems. The deeper we are in the funnel, the bigger the sustainability challenge.
Driven into reductionism
Another development following the industrialisation period is the learned pattern to chop things into pieces. Henry Ford demonstrated efficiency by dividing the manufacturing of a car into smallest possible work steps or tasks. Each single production step must be optimised to the limit. The total sum of all steps represents the outmost efficient process to build cars that are affordable. The idea was good, but we know today that this approach alone won’t provide effectiveness.


Furthermore, people being exposed to increased stress and complexity tend to narrow their view and focus on parts and details because of mental overload. The consequences: people are no longer capable of maintaining an overview and keeping the big picture in mind. This leads us to looking at details or symptoms instead of focusing on the problem itself. We react to economically driven short-term headlines instead of bringing issues into the right context.
Scientists keep on arguing about when exactly the polar ice will melt down. Governments pass laws and regulations with good intentions, but without a systems understanding and thereby cause damage elsewhere or at a later time. We might know everything about a specific detail, but lose track of its larger context. We don’t see the wood for the trees. This we define as “reductionism”.
A growing number of organisations and individuals are aware of the major dependencies between the economy, society and the environment. Even if there is an understanding that these are interrelated, very few understand how the three aspects are connected.


One model commonly being referred to is “People, Planet, Profit”, coined in the late 1990’s by John Elkington. It is often described as three circles, partially overlapping each other, visualising that there must be some kind of balance. Sustainability can be found in the middle, where the circles intersect, [1] followed by areas that only concern two out of three aspects [2]. The left-over areas suggest that a large part of each system [3] is not dependent on any of the other aspects. When using this model, the challenge remains to find the right balance between the systems.

Summing up the challenge
UNITED NATIONS SUSTAINABLE DEVELOPMENT GOALS
In September 2015, the 193 countries of the UN General Assembly adopted 17 Sustainable Development Goals (SDGs) with a view to ending poverty, protecting the planet and ensuring prosperity for all. Each SDG is accompanied by a set of targets for 2030. Governments around the globe are expected to take ownership and establish national frameworks to achieve these goals. The SDGs are not legally binding, but require that we all play our part to reach them. How can we achieve change to meet these goals without ultimate commitment?
THE NATURAL STEP’S WHOLE SYSTEMS APPROACH
Only once we understand that we need to interconnect the various dimensions of the challenge, are we able to recognise what is happening in reality. Based on our key insights outlining the challenge and the creation of a common language, we can change to a holistic view and apply a systemic approach.
To prevent colliding with the walls of the funnel, we first need to change direction and slow down trends to stop further degradation of the systems we depend upon. Then the goal must be to get to the opening of the funnel where the opportunities for prosperity have stopped declining. In other words: a steady state or a sustainable society. This is not Utopia. It is a situation in which the ecological and social systems can continue to support us.

Our sustainability challenge is to get to the opening of the funnel without colliding with the walls! At The Natural Step this is what we call sustainable development. So the good news is: there is a solution and you are not alone. Applying our systems approach, we are able to drive real change and provide value for everyone without destroying our planet.


